SUMMARY OF ALL SP500 UPTRENDS AND CONSOLIDATIONS


THANKS TO YOU ALL-MY PAGEVIEWS SKYROCKETED IN JAN2012,ONE MONTH ALONE is EQUAL TO 6MONTHS OF

PAGEVIEWS!!A BIG THANK YOU

SINCE THIS THREAD "SUMMARY OF ALL SP500 UPTRENDS AND CONSOLIDATIONS" THREAD IS SO POPULAR,THE HIGHEST VIEWERSHIP,I PUT IT IN THE FRONT PAGE

SUMMARY OF ALL SP500 uptrends and consolidations

UPTRENDS-

1. Mostly 10weeks,although some may be 9,11,12.how to recognize?--uptrend "mysteriously" maintained by a diagonal uptrendline connecting the lows of that 10weeks uptrend

2. 1st and last(10th) week always end in surges of aorund 3-6%with the least 1st week gain was 2.7%.The humpy uptrend will "mysteriously" start and end with surges up.

3. If the (X-1)th 10+weeks end below a fibo of the 1576-666 range,THEN the next,Xth, 10+weeks will end AT THAT FIBO.

4. If the (X-1)th 10+weeks end ABOVE a fibo of the 1576-666 range,then the NEXT,Xth, 10+weeks will end AT THE NEXT HIGHER FIBO.

5. Every year's end, at the last trading day of the year,sp500 will end near a fibo of 1576-666 range.

6. Every 10+weeks uptrend will start AFTER a double testing of the diagonal uptrend line formed by the humps from july 13th week 2009.

7. The uptrend in the secular bear market,before breakout 1576, will be a "humpy" ride,whereby i forecast a total of 4 humps to test 1576.

8. After the sp500 breaks out of the 1576 resistance,the diagonal uptrendline will be much sharper than the uptrendline of the 4 humps.

9. The peaks of each hump will occur at AROUND 350-360 POINTS ABOVE THE CORRECTION TESTED FIBONACCI.

10. 2009 REPLICATE 2003,2010 REPLICATE 2004,2011 REPLICATE 2005,SO ON--I mean the closing values and their respective fibo,

CONSOLIDATIONS-CORRECTIONS AND RETRACEMENTS

1. Every correction will have one week of huge plunge about 100points in sp500

2. every Long/HUGE weekly plunge of around 5-8% in the sp500 will be met with a return to the start BEFORE the huge plunge(weekly open) of THAT LONG WEEKLY DOWN CANDLEBODY in 23 to 24 weeks

3. After the peak of each hump has been achieved,there will come a plunge BACK to the fibo of 1576-666 range.---------

eg. 1st hump ended at 1219,near 61.8%,then sp500 plunged back to retest the 38.2%,before the NEXT hump will be formed

eg. 2nd hump peaked at 1370,near the 78.6%,then sp500 plunged back to retest the 50%..so on..

1st correction went to the 38.2%,1013, lowest 1010 and built a base around 1065

-took 24 weeks to reach the open of the HUGE weekly plunge of 120points,week of MAY 3RD 2010

-dropped a total of 210points-2nd week from the top of the 4th 10+weeks uptrend pattern 1217,was the huge weekly plunge

-took 8weeks to hit the lowest point 1010

2nd correction went to 1074 lowest,BUT built a base around the 50% fibo,1120.

-took 23 weeks to reach the open pf the 2nd HUGE weekly plunge of 120points,week of August 1, 2011

-dropped a total of 270points from 1344 and 300points from the HEAD peak 1370

-the huge weekly drop also happened in the 2nd week from the 5th 10+weeks uptrend pattern close peak of 1344.,the LEFT SHOULDER OF THE head and shoulders

-took 9weeks to hit the lowest point 1074

THIS IS THE NEW AND IMPROVISED VERSION OF THE MOST POPULAR POST IN MY BLOG


LET US RECALL THE LIES OF MEDIA OR PEOPLE WHO DON'T KNOW HOW TO EXPLAIN

1)DATA GOOD,COMPANIES EARNINGS GOOD,INDEX DROP= "FACTORED IN" OR "LESSEN STIMULUS HOPES"

2)DATA BAD,COMPANIES EARNINGS BAD,INDEX RISE="INCREASED STIMULUS HOPES"

3)WHEN USA CRISIS CAME,FULL OF CDO SHIT PROBLEM,NO1 KNOWS THERE WILL BE A EUROPE CRISIS IN 2009.THEN CAME EUROPE CRISIS.

4)WHEN EUROPE CRISIS BECOME STALE NEWS,FOCUS SHIFT TO LIBYA GADDAFI TO "EXPLAIN" DROP IN USA MARKETS

5)THEN AFTER GADDAFI NEWS BECAME STALE,THEY SHIFT BACK TO EUROPE AND CHANGE TO "AUSTERITY" SHIT

6)THEN AFTER EURO AUSTERITY NEWS BECOME STALE,THEY SHIFT FOCUS BACK TO USA AND INTRODUCED "FISCAL CLIFF" SHIT JUST BECAUSE BERNANKE MENTIONED FISCAL CLIFF

I "LOVE" THEIR SHIT.EVERYTIME THE STORY BECOMES OLD AND STALE,SOMETHING NEW WILL POP OUT AND THE OLD ONE WILL NEVER BE MENTIONED AGAIN-SINK INTO OBLIVION!!

1ST CDO,LIBYA,AUSTERITY,NOW FISCAL CLIFF.NEXT FUCK YOU!!DID CDO SHIT RESURFACE AGAIN NOW?WHO REMEMBER GADDAFI,LIBYA PROBLEMS SUDDENLY SOLVED FOREVER??

GRANDMOTHER STORY SPINNERS FUCKERS.


19th October 2013
NEPTUNE ORIENT LINES ROBOTIC PATTERN
1) BASE
A-
WEEK oF 17 NOVEMBER 2008—0.93
Week of 9 March 2009—0.85
DOUBLE BOTTOM HIT
3+ MONTHS APART
BETWEEN 1ST AND 2ND BOTTOM
RALLIED +182% IN
1YEAR,1 MONTH, HIT NEAR 2.40 IN APRIL 2010
2) BASE
B-
Week of 22 August 2011—0.98
Week of 21 November 2011---0.995
DOUBLE BOTTOM HIT
3 MONTHS APART BETWEEN
1ST AND 2ND BOTTOM
RALLIED +53% IN 3
months.HIT 1.515 IN 20 FEBRUARY 2012 WEEK


3) BASE
C-
Week of 23 July 2012—1.05
Week of 19 November 2012---1.05
DOUBLE BOTTOM HIT
3+ MONTHS APART
BETWEEN 1ST AND 2ND BOTTOM
RALLIED +30% IN 1.5months.HIT
1.36 IN 7 January 2013 WEEK

4) NOW,IT
IS BASE D TIME
Week of 10 June 2013—1.025
Week of 26 August 2013---1.025
DOUBLE BOTTOM HIT
Near 3 MONTHS APART
BETWEEN 1ST AND 2ND BOTTOM
RALLIED ????% by
??????


N.O.L-NEPTUNE ORIENT LINES-N03.SI (WEEKLY CHARTS) YEAR 2006:6 NOVEMBER TO 1ST JAN2007: 1.77 TO 2.20 (+43c) YEAR 2008:17NOVEMBER TO 5JAN2009: 0.84 TO 1.175 (+33.5c) YEAR 2009:2NOVEMBER TO 11JAN2010: 1.51 TO 1.94 (+43c) YEAR 2010:22NOVEMBER TO 3JAN2011: 2.07 TO 2.40 (+33c) YEAR 2011:21NOVEMBER TO 30JAN2012: 0.995 TO 1.43 (+43.5c) YEAR 2012:19NOVEMBER TO 7JAN2013: 1.055 TO 1.36 (+30.5c)


Tuesday, July 9, 2013

9th July 201300EXACTLY WHAT I SAID IN THE PREVIOUS POST RIGHT BELOW TODAY'S

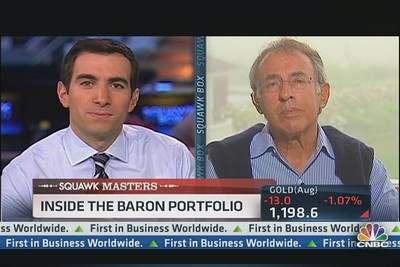
Dow Will Hit 60,000 in 20 Years, Ron Baron Says

Text Size
Published: Monday, 8 Jul 2013 | 8:45 AM ET

By: | CNBC Senior Talent Producer

Twitter
116

LinkedIn
16
Share

Chip East | Bloomberg | Getty Images
Ron Baron
On June 20, a day when investors were heading for the hills and the market was down sharply, Ron Baron's Baron Capital saw its strongest inflows of the year.
The markets plunged that day after Federal Reserve Chairman Ben Bernanke indicated the central bank was getting ready to exit its extreme monetary easing program.
When asked about the recent equity market sell-off that accompanied Fed fears, the renowned buy-and-hold investor stressed buying and selling on news is not a good strategy.
(Read More: One Eye on Earnings, the Other on Bonds)
"Money is running from bonds and gold. I think people investing in bonds can have significant capital depreciation over the next several years," he said in an interview.
Baron's Long-Term Theme Picks
Ron Baron, Baron Capital chairman & CEO, shares where he is his seeing long-term investment opportunities in technology and brick &mortar plays.
"Everyone thinks they are advantaged by trading on news. They are not. This is why the average investor in mutual funds makes 3 percent per year while the average mutual fund earns 7 percent per year." Baron added.
"Investors who base their buy and sell decisions on current news generally sell and buy at exactly the wrong times. It's crazy," he continued.
(Read More: Get Ready for Earnings—It's Prove-It Time)
The biggest market mover this summer has been worries the Fed will pull back on its $85 billion a month bond-buying as part of quantitative easing.
"Investors are selling aggressively reacting to news the Fed's announcement that they might slow their open market bond purchases because the economy is steadily improving."
The economic recovery, he said, is the reason why now is a "great time to buy."
(Read More: Job Growth Posts Large Gain in June; Rate Holds)
"Companies have almost doubled their earnings in the past 13 years while stock prices have increased only about 25 percent," he said.
Expecting stock market returns for the next 20 years to approximate the 7 percent annual returns earned by U.S. stocks for generations, Baron quoted Albert Einstein that "the most powerful force in the universe is compound interest."
He said in his opinion based on the compounding effect, "the Dow Jones will be 30,000 in 10 years, 60,000 in 20 years."
Baron is putting his money behind his words.
Some stocks Baron Capital has recently purchased include Concho Resources, Edwards Lifesciences, Hyatt, Caesarstone, Manchester United, Dick's Sporting Goods and Under Armour.
Emphasizing these purchases are not for the short-term, Baron stressed the average length of time his firm holds their stocks is seven years.
"This is the beginning, not the end for stocks." said Baron. "You should not be afraid to invest now."
_By CNBC's Lori Ann LaRocco. Follow her on Twitter

ONLY IDIOTS,MORONS LISTEN TO CURRENT NEWS AND THEIR FUCKING GRANDMOTHER STORIES.TODAY STCKMARKET UP,DATA BAD-NEWS WILL SAY "DIMINISHED HOPES OF FED TAPERING BOOST STOCKS"

THE VERY NEXT DAY,STOCKS SURGE AGAIN ON VERY GOOD DATA,ABOVE EXPECTATIONS-THEN YOU WILL SEE A BUNCH OF SPIN TALL TALES SHITS SAYING"MAYBE THE INVESTORS SHRUG OFF FED TAPERING FEARS AND THE ECONOMY IS REALLY VERY STRONG TO STAND ON ITS OWN FEET"

INVESTORS SUDDENLY HAVE DUAL PERSONALITY,SUDDENLY SO AFRAID OF FED TAPERING,SUDDENLY SO NONCHALANT ABOUT FED TAPERING.

I,AS USUAL,SAY "FUCK YOU,NEWS".MY BLOG HAS ABSOLUTELY ZERO NEWS OF FED TAPERING SHIT,EGYPT POLITICAL TURMOIL SHIT,CHINA SHIT SHIBOR FEARS,PORTUGAL POLITICAL TURMOIL SHIT,ETC.THE DAY I POST CURRENT NEWS IN MY BLOG IS THE DAY I GO TO INSTITUTE OF MENTAL HEALTH FOR TREATMENT OF "SPLIT PERSONALITY" OR "DUAL PERSONALITY".

I BET WITH YOU.ANYBODY WHO OBEY CURRENT NEWS 100% CANNOT EVEN SURVIVE BEING A FULLTIME INVESTOR EVEN FOR 1YEAR
.
No comments:

Post a Comment