SUMMARY OF ALL SP500 UPTRENDS AND CONSOLIDATIONS


THANKS TO YOU ALL-MY PAGEVIEWS SKYROCKETED IN JAN2012,ONE MONTH ALONE is EQUAL TO 6MONTHS OF

PAGEVIEWS!!A BIG THANK YOU

SINCE THIS THREAD "SUMMARY OF ALL SP500 UPTRENDS AND CONSOLIDATIONS" THREAD IS SO POPULAR,THE HIGHEST VIEWERSHIP,I PUT IT IN THE FRONT PAGE

SUMMARY OF ALL SP500 uptrends and consolidations

UPTRENDS-

1. Mostly 10weeks,although some may be 9,11,12.how to recognize?--uptrend "mysteriously" maintained by a diagonal uptrendline connecting the lows of that 10weeks uptrend

2. 1st and last(10th) week always end in surges of aorund 3-6%with the least 1st week gain was 2.7%.The humpy uptrend will "mysteriously" start and end with surges up.

3. If the (X-1)th 10+weeks end below a fibo of the 1576-666 range,THEN the next,Xth, 10+weeks will end AT THAT FIBO.

4. If the (X-1)th 10+weeks end ABOVE a fibo of the 1576-666 range,then the NEXT,Xth, 10+weeks will end AT THE NEXT HIGHER FIBO.

5. Every year's end, at the last trading day of the year,sp500 will end near a fibo of 1576-666 range.

6. Every 10+weeks uptrend will start AFTER a double testing of the diagonal uptrend line formed by the humps from july 13th week 2009.

7. The uptrend in the secular bear market,before breakout 1576, will be a "humpy" ride,whereby i forecast a total of 4 humps to test 1576.

8. After the sp500 breaks out of the 1576 resistance,the diagonal uptrendline will be much sharper than the uptrendline of the 4 humps.

9. The peaks of each hump will occur at AROUND 350-360 POINTS ABOVE THE CORRECTION TESTED FIBONACCI.

10. 2009 REPLICATE 2003,2010 REPLICATE 2004,2011 REPLICATE 2005,SO ON--I mean the closing values and their respective fibo,

CONSOLIDATIONS-CORRECTIONS AND RETRACEMENTS

1. Every correction will have one week of huge plunge about 100points in sp500

2. every Long/HUGE weekly plunge of around 5-8% in the sp500 will be met with a return to the start BEFORE the huge plunge(weekly open) of THAT LONG WEEKLY DOWN CANDLEBODY in 23 to 24 weeks

3. After the peak of each hump has been achieved,there will come a plunge BACK to the fibo of 1576-666 range.---------

eg. 1st hump ended at 1219,near 61.8%,then sp500 plunged back to retest the 38.2%,before the NEXT hump will be formed

eg. 2nd hump peaked at 1370,near the 78.6%,then sp500 plunged back to retest the 50%..so on..

1st correction went to the 38.2%,1013, lowest 1010 and built a base around 1065

-took 24 weeks to reach the open of the HUGE weekly plunge of 120points,week of MAY 3RD 2010

-dropped a total of 210points-2nd week from the top of the 4th 10+weeks uptrend pattern 1217,was the huge weekly plunge

-took 8weeks to hit the lowest point 1010

2nd correction went to 1074 lowest,BUT built a base around the 50% fibo,1120.

-took 23 weeks to reach the open pf the 2nd HUGE weekly plunge of 120points,week of August 1, 2011

-dropped a total of 270points from 1344 and 300points from the HEAD peak 1370

-the huge weekly drop also happened in the 2nd week from the 5th 10+weeks uptrend pattern close peak of 1344.,the LEFT SHOULDER OF THE head and shoulders

-took 9weeks to hit the lowest point 1074

THIS IS THE NEW AND IMPROVISED VERSION OF THE MOST POPULAR POST IN MY BLOG


LET US RECALL THE LIES OF MEDIA OR PEOPLE WHO DON'T KNOW HOW TO EXPLAIN

1)DATA GOOD,COMPANIES EARNINGS GOOD,INDEX DROP= "FACTORED IN" OR "LESSEN STIMULUS HOPES"

2)DATA BAD,COMPANIES EARNINGS BAD,INDEX RISE="INCREASED STIMULUS HOPES"

3)WHEN USA CRISIS CAME,FULL OF CDO SHIT PROBLEM,NO1 KNOWS THERE WILL BE A EUROPE CRISIS IN 2009.THEN CAME EUROPE CRISIS.

4)WHEN EUROPE CRISIS BECOME STALE NEWS,FOCUS SHIFT TO LIBYA GADDAFI TO "EXPLAIN" DROP IN USA MARKETS

5)THEN AFTER GADDAFI NEWS BECAME STALE,THEY SHIFT BACK TO EUROPE AND CHANGE TO "AUSTERITY" SHIT

6)THEN AFTER EURO AUSTERITY NEWS BECOME STALE,THEY SHIFT FOCUS BACK TO USA AND INTRODUCED "FISCAL CLIFF" SHIT JUST BECAUSE BERNANKE MENTIONED FISCAL CLIFF

I "LOVE" THEIR SHIT.EVERYTIME THE STORY BECOMES OLD AND STALE,SOMETHING NEW WILL POP OUT AND THE OLD ONE WILL NEVER BE MENTIONED AGAIN-SINK INTO OBLIVION!!

1ST CDO,LIBYA,AUSTERITY,NOW FISCAL CLIFF.NEXT FUCK YOU!!DID CDO SHIT RESURFACE AGAIN NOW?WHO REMEMBER GADDAFI,LIBYA PROBLEMS SUDDENLY SOLVED FOREVER??

GRANDMOTHER STORY SPINNERS FUCKERS.


19th October 2013
NEPTUNE ORIENT LINES ROBOTIC PATTERN
1) BASE
A-
WEEK oF 17 NOVEMBER 2008—0.93
Week of 9 March 2009—0.85
DOUBLE BOTTOM HIT
3+ MONTHS APART
BETWEEN 1ST AND 2ND BOTTOM
RALLIED +182% IN
1YEAR,1 MONTH, HIT NEAR 2.40 IN APRIL 2010
2) BASE
B-
Week of 22 August 2011—0.98
Week of 21 November 2011---0.995
DOUBLE BOTTOM HIT
3 MONTHS APART BETWEEN
1ST AND 2ND BOTTOM
RALLIED +53% IN 3
months.HIT 1.515 IN 20 FEBRUARY 2012 WEEK


3) BASE
C-
Week of 23 July 2012—1.05
Week of 19 November 2012---1.05
DOUBLE BOTTOM HIT
3+ MONTHS APART
BETWEEN 1ST AND 2ND BOTTOM
RALLIED +30% IN 1.5months.HIT
1.36 IN 7 January 2013 WEEK

4) NOW,IT
IS BASE D TIME
Week of 10 June 2013—1.025
Week of 26 August 2013---1.025
DOUBLE BOTTOM HIT
Near 3 MONTHS APART
BETWEEN 1ST AND 2ND BOTTOM
RALLIED ????% by
??????


N.O.L-NEPTUNE ORIENT LINES-N03.SI (WEEKLY CHARTS) YEAR 2006:6 NOVEMBER TO 1ST JAN2007: 1.77 TO 2.20 (+43c) YEAR 2008:17NOVEMBER TO 5JAN2009: 0.84 TO 1.175 (+33.5c) YEAR 2009:2NOVEMBER TO 11JAN2010: 1.51 TO 1.94 (+43c) YEAR 2010:22NOVEMBER TO 3JAN2011: 2.07 TO 2.40 (+33c) YEAR 2011:21NOVEMBER TO 30JAN2012: 0.995 TO 1.43 (+43.5c) YEAR 2012:19NOVEMBER TO 7JAN2013: 1.055 TO 1.36 (+30.5c)


Wednesday, March 20, 2013

20th march2013---a very unique and detailed analysis on relationship between bdi and sse

A VERY INTERESTING IDEA PROMPTED ME TO DO INTENSIVE RESEARCH TO INVESTIGATE THE CLOSE RELATIONSHIP BETWEEN SHANGHAI COMPOSITE(SSE) AND BALTIC DRY INDEX(BDI)

SSE STARTING VALUE 100 IN YEAR 1991
BDI TAKING THE BASE OF 1986 OF 600+

ALL ARE APPROX VALUES,NOT EXACT

WE TAKE THE PEAKS AND LOWEST POINTS OF BDI AND SSE RESPECTIVELY,AND CALCULATE THE AMOUNT OF UPSIDE SSE HAS PERFORMED SINCE 1991 AND BDI HAS PERFORMED SINCE 1986.

YEAR

1986-BDI LOWEST
1991-SSE STARTED AT 100(LOWEST)

1992-SSE (LOWEST AFTER DROP)-500pts---UP 5X
BDI-LOWEST AFTER DROP-1000pts---UP 66%

SSE OUTPERFORMED BDI BY 3X

mid1994-SSE LOWEST AFTER DROP--333pts---UP 3.3X
BDI--1500--in the middle of uptrend after hitting lowest in 1992--UP 2.5X

SSE OUTPERFORMED BDI BY 1.32X

Mid1995-SSE IN MIDDLE OF UPTREND,AFTER HIT LOWEST IN JULY1994--900--UP 9X
BDI hit peak 2500 points--UP 4X

SSE OUTPERFORMED BDI BY 2.25X

MID1997-sse hit peak 1500--up 15X
BDI 1500,up 2.5x

SSE OUTPERFORMED BDI BY 6X

End1998-SSE HIT LOWEST 1000---UP 10X
BDI 800--UP 30%


SSE OUTPERFORM BDI BY 7.7X

mid 1999-sse break out of 7years secular bear--1500-UP 15X
bdi 1000---up 66%

SSE OUTPERFORMED BDI BY 9X

MID2001-sse hit maximum 2245--up 23X
bdi 1500---up 2.5X

SSE OUTPERFORMED BDI BY 9X

end2001-sse went back retest resistance 1500--up 15x
bdi drop to lowest after uptrend from cycle low-900---up 50%

SSE OUTPERFORMED BDI BY 10X

2003-2004-sse hovered in range of 1000-1500,up 10-15x
bdi hit double top 6000,up 10x

SSE OUTPERFORMED BDI BY 1.5X

mid 2005-start2006--sse drop to lowest 1000-up10x
bdi drop to cycle lowest 2000points-up 3x

SSE OUTPERFORMED BDI BY 3.3X

end 2007-sse highest 6124--up 60X
bdi 12000,up 20x

SSE OUTPERFORMED BDI BY 3X

end2008--sse drop to lowest 1667---up 16x
bdi 700+,bdi up 10+%,

sse outperformed bdi by 15X

mid2009--sse up till 3500---up 35x
bdi up till 4500,up 7x

sse outperformed bdi by 5x

end2012---sse plunged till 1957---up 20x
bdi down till 1986 lowest--unchanged

sse outperformed bdi by 20x

CONCLUSIONS OF MY RESEARCH

(1) SSE OUTPERFORM BDI CANNOT REMAIN IN DOUBLE DIGITS CONSECUTIVELY.

(2)BUT SSE CAN REMAIN IN SINGLE DIGITS CONSECUTIVELY.

(3)SSE OUTPERFORM BDI 20X IN DEC2012 IS THE HIGHEST EVER MEANING IT IS THE LOWEST BDI EVER.

(4)NOW BDI AND SSE TENDS TO HIT PEAK AND BOTTOM TOGETHER AT ROUGHLY THE SAME TIME,SHOWING VERY VERY CLOSE RELATIONSHIP BETWEEN BDI AND SSE.

IN SUMMARY,IF DARYL GUPPY'S SHANGHAI COMPOSITE TARGET OF 3500 BY YEAR 2013 END IS TO COME TRUE(HENCE MY END2014,SHANGHAI COMP 6000 TARGET WILL ALSO COME TRUE AS GUPPY'S PREDICTION IS A "SUBSET" OF MINE),THEN SSE WILL BE 35X 1991 STARTING VALUE,AND SINCE BDI HAS TO RETURN TO SINGLE DIGITS,MOST CONSERVATIVE IS 9X SSE OUTPERFORM BDI,THAT MEANS BDI MUST UP NEAR 4X FROM 600s,MEANING 2000-2400s AT THE SAME TIME SHANGHAI COMPOSITE HIT 3500.

BDI AT 2000-2400 WHEN SSE AT 3500(SSE OUTPERFORM BDI BY 9X)BY 2013END IS ALREADY THE MOST CONSERVATIVE ESTIMATE AS THE RATIO SSE OUTPERFORM BDI CAN PLUNGE TO AS LOW AS 2-3X,MEANING BDI CAN RISE TO AS HIGH AS 6000s to 7000s



Wednesday, March 13, 2013

13th march2013-i am deeply honoured that my predictions are same as master daryl guppy

PLEASE LOOK AT HOW SIMILAR MY TWO PREDICTIONS OF USA MAIN INDICES AND SHANGHAI COMPOSITE IS TO THE GREAT DARYL GUPPY PREDICTIONS.

1)IN MY EARLIER POSTS,I SAID USA WILL HAVE A 8-12WEEKS RETRACEMENT AFTER THIS WEEK AND AFTER THAT, A NEW 10+WEEKS UPTREND WILL EMERGE...ON 4TH MARCH 2013,GUPPY SAID THAT USA MAIN INDEX READY TO FALL FOR NEXT 7WEEKS.

2)I SAID SHANGHAI COMPOSITE TO TEST THE ALL TIME HIGH AT 6000-6124 BY OCTOBER2014 TO EARLY 2015,AND FOR THAT TO HAPPEN,DARYL GUPPY'S PREDICTION THAT SHANGHAI COMPOSITE TARGET IS TO RETEST 3500 BY 2013 END.DARYL GUPPY'S PREDICTION OF 3500 FOR SHANGHAI COMPOSITE BY 2013 END IS A "MUST" AND DECIDING FACTOR WHETHER MY TARGET 6000-6124 BY OCTOBER2014 WILL COME TRUE.

I AM VERY HONOURED TO HAVE REACHED THE SAME STANDARD AS THE MASTER HIMSELF,DARYL GUPPY


13th march 2013-i am deeply honoured to have two of my latest predictions in line with the master,daryl guppy

(1)Friday, February 22, 2013

Daryl Guppy: Shanghai Composite 45% upside move (2013)

As titled in CNBC "Shanghai Composite to Hit 3,500 This Year?"

Daryl Guppy from guppytraders.com is bullish in the Shanghai Composite and this looks like a 45% move from the date of the interview.
http://video.cnbc.com/gallery/?video=3000148790

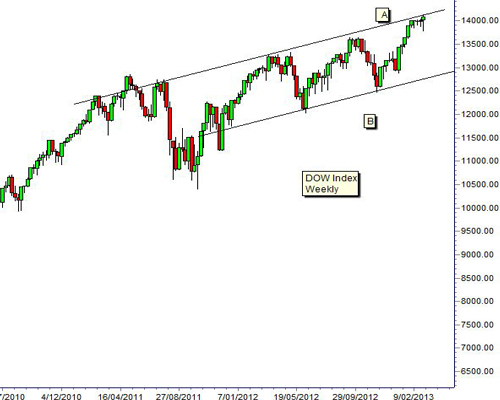
(2)Dow to Fall Over Next 7 Weeks: Chart

Text Size
Published: Monday, 4 Mar 2013 | 9:09 PM ET

By: CNBC Contributor


Twitter


LinkedIn


Share
The Dow Jones Industrial Average has developed a long term up-sloping trading channel. A trading band is created when there are clearly defined horizontal support and resistance levels. Price movements rebound between these levels. Traders buy at the support level and sell at the resistance level. Many trading-band trades are part of a prolonged sideways price movement.

Trading channels are created when the stocks trend upwards and two parallel trend lines can be plotted. These also act as support and resistance levels but the value of these levels changes over time. Traders buy on support and sell on resistance. These trades are more profitable as the resistance level moves upwards over time.

The upper edge of the trading channel is well defined on the weekly chart of the Dow. It starts with the high in July 2011 near 12,650. The second anchor point is the high in March 2012 near 13,250. The current index activity is testing the position of the upper trend line near 14,100.
(Read More: 'Powerful Force' Underpins Stocks)
The lower edge of the trading channel is not so well defined. The first anchor point is in June 2012 near 12,100. The second anchor point is in November 2012 near 12,490. This chart pattern needs a third anchor point to confirm the placement of the lower trend line and to fully confirm the channel trading pattern.
The lower trend line is parallel to the upper trend line. It is projected into the future and this provides a method to determine the potential low for the Dow in any market retreat. The current value is near 12,820. The history of the current trading channel in the Dow shows the market usually takes around seven weeks to fall from the top of the channel to the lower edge of the trading channel. The market rebound and rise towards the upper edge of the channel takes between 10 and 18 weeks.
The 14,198 level is significant because this was the high achieved in October 2007. This becomes an important psychological point for the market. Any move above this level has a high probability of developing a consolidation and a retreat pattern. The 14,198 level is near to the current value of the upper edge of the trading channel. This second feature also increases the probability of a retreat rather than a breakout above the trend line.
The pattern of the trading channel suggests a higher probability to a retreat towards the lower trend line. This retreat may take around seven weeks before a new rally develops. Investors will be ready to protect profits and then prepare to enter the market as the index rebounds from the lower trend line.
Daryl Guppy is a trader and author of Trend Trading, The 36 Strategies of the Chinese for Financial Traders –www.guppytraders.com. He is a regular guest on CNBCAsia Squawk Box. He is a speaker at trading conferences in China, Asia, Australia and Europe.

If you would like Daryl to chart a specific stock, commodity or currency, please write to us at ChartingAsia@cnbc.com. We welcome all questions, comments and requests.
NBC assumes no responsibility for any losses, damages or liability whatsoever suffered or incurred by any person, resulting from or attributable to the use of the information published on this site. User is using this information at his/her sole risk.


Twitter


LinkedIn


Share

The history of the current trading channel in the Dow shows the market usually takes around seven weeks to fall from the top of the channel to the lower edge of the trading channel.

Sunday, March 10, 2013

10th march2013--PLEASE LOOK AT MY EARLIER PREDICTIONS=SO DAMN TRUE ABOUT SP500 PEAKING IN THE 9TH 10+WEEKS UPTREND AT AROUND 1550-1560

WHAT IS THE SP500 VALUE ON FRIDAY NIGHT???

1551!!!!EXACTLY IN MY RANGE STATED EARLIER!!

9TH 10+WEEKS UPTREND BINGO!!!I SAID 1550-1560.IN THE END 1551!!!!

8TH 10+WEEKS UPTREND ALSO BINGO!!I SAID SP500 TO PEAK IN 8TH 10+WEEKS UPTREND AT AROUND 1460-1480--PLEASE LOOK AT MY EARLIER POSTS FOR PROOF.,IN THE END,WHAT WAS THE VALUE???1474!!!

NOW SP500 WILL START A 8-12 WEEKS OF RETRACEMENT,NOT A CORRECTION,FINAL TARGET OF RETRACEMENT IS 1400-1420.

note:sp500 DOES NOT MEAN SP500 MUST PLUNGE IMMEDIATELY.PLEASE DO NOT BE A PARANOID GAUL WHO ALWAYS THINK THE SKY WILL FALL ON YOUR HEAD.SP500 WILL BE IN A "HOLDING PERIOD" BETWEEN 1520 TO EVEN 1576 FOR AT LEAST 4 WEEKS.AFTER THE BREAKDOWN OF 1518-1520 WILL COME A VERY QUICK SLIDE OF 100POINTS TO THE FINAL TARGET 1400-1420

SAID ON 10TH MARCH 2013 

10th march 2013-CHINA AND THE BDI CHARTS TALLY!!


THE 1ST CHART ON THE UPPERMOST TOP,BALTIC DRY INDEX CHART WAS TAKEN FROM http://caldaro.wordpress.com/2012/09/27/dry-bulk-shipping-industry/

BALTIC DRY INDEX HAS A 13YEAR CYCLE OF LOWEST TO NEXT CYCLE LOWEST,NAMELY 1973-1986-1999-2012.AFTER THE CYCLICAL LOW,IN THE RECOVERY PHRASE,RATES TYPICALLY TRIPLE IN 2-3YEARS TIME.

THIS IS IN LINE WITH SHANGHAI COMPOSITE 7YEARS TO PAST RESISTANCE,DOUBLE TOP,TRAPPED IN SECULAR BEAR MARKET.LAST TIME IN THE MAY1992-MAY 1999,SHANGHAI COMPOSITE RETESTED THE 1500s RESISTANCE 4 TIMES IN 7YEARS.NOW 5+YEARS HAVE PASSED,AND THE SHANGHAI COMPOSITE HAS NOT EVEN TESTED 6000-6124 ONCE.MOREOVER,SHANGHAI COMPOSITE IS WELL KNOWN TO BE SURGING MULTIPLES AFTER RESTING FOR A LONG PERIOD OF DOWNTREND,NAMELY,(1)JUNE 1994-MAY1997,IT SURGED UP NEARLY 5x IN 3YEARS,(2)2005-2007,IT SURGED UP NEARLY 6X IN 2 YEARS,ONLY AFTER A LONG REST OF 4YEARS DOWNTREND.OCTOBER2007+7YEARS=OCTOBER2014 TO EARLY2015!!

SHANGHAI COMPOSITE CYCLE TIMING IS IN LINE WITH BALTIC DRY INDEX CYCLE TIMING=BOTH "AGREE" ON RISING 3X IN 2-3YEARS FROM DECEMBER2012!!

AMAZING COORDINATION!!


Saturday, March 2, 2013

2ND MARCH 2013==PROPOSED FUTURE OF SHANGHAI COMPOSITE,SSE AND SP500


SHANGHAI COMPOSITE FROM 1992 TO 1999 STUCK IN RANGE OF 1500s TO 300s

NOW SHANGHAI COMPOSITE HAS NOT EVEN RE VISITED 6124 SINCE OCT 2007 AND THIS IS ALREADY 5+YEARS AND COUNTING.SO JUDGING FROM SHANGHAI PAST 7YEARS ALSO HIT THE SAME TOP AND SP500's FAMOUS 2000 AND 2007 DOUBLE TOP IS ALSO 7 YEARS,WHICH MEANS SHANGHAI COMPOSITE SHOULD REVISIT 6000-6124 BY OCTOBER 2014 TO 2015.

Friday, March 1, 2013

march 1st,2013-SP500 NEAR TERM FUTURE

STAGES OF REMAINING TIME IN SP500 3RD HUMP-IN CHRONOLOGICAL ORDER

1)SP500 WILL PEAK AT NEXT WEEK AROUND 2-3% GAIN IN ONE WEEK,BY NEXT FRIDAY,8TH MARCH 2013,1560-1576.NEXT WEEK WILL BE THE FINAL WEEK OF USA 9TH 10+WEEKS UPTREND.

2)AFTER WHICH WILL COME SP500 RETRACEMENT TILL 1400-1420.

3)AFTER RETRACEMENT WILL COME THE LAST 10+WEEKS UPTREND,THE 10TH TO SP500 1600-1620.

4)AFTER WHICH,SP500 3RD HUMP WILL END,THEN WILL COME THE CORRECTION.

NOT EVERY DROP= CORRECTION.PLEASE DO NOT ANYHOW ABUSE THE TERM CORRECTION TO BE AS LOOSE AS A OLD PROSTITUTE'S CUNT!!

HOW I KNOW??

ANSWER IN THE DOWJONES,RUSSELL2000 AND SP500 CHARTS.I WILL NOT REVEAL OVER THE INTERNET.

SAID ON 1ST MARCH 2013