
(1)Friday, February 22, 2013
Daryl Guppy: Shanghai Composite 45% upside move (2013)
As titled in CNBC "Shanghai Composite to Hit 3,500 This Year?"
Daryl Guppy from guppytraders.com is bullish in the Shanghai Composite and this looks like a 45% move from the date of the interview.
http://video.cnbc.com/gallery/?video=3000148790
Daryl Guppy from guppytraders.com is bullish in the Shanghai Composite and this looks like a 45% move from the date of the interview.
http://video.cnbc.com/gallery/?video=3000148790
(2)Dow to Fall Over Next 7 Weeks: Chart
The Dow Jones Industrial Average has developed a long term up-sloping trading channel. A trading band is created when there are clearly defined horizontal support and resistance levels. Price movements rebound between these levels. Traders buy at the support level and sell at the resistance level. Many trading-band trades are part of a prolonged sideways price movement.
Trading channels are created when the stocks trend upwards and two parallel trend lines can be plotted. These also act as support and resistance levels but the value of these levels changes over time. Traders buy on support and sell on resistance. These trades are more profitable as the resistance level moves upwards over time.
The upper edge of the trading channel is well defined on the weekly chart of the Dow. It starts with the high in July 2011 near 12,650. The second anchor point is the high in March 2012 near 13,250. The current index activity is testing the position of the upper trend line near 14,100.
(Read More: 'Powerful Force' Underpins Stocks)
The lower edge of the trading channel is not so well defined. The first anchor point is in June 2012 near 12,100. The second anchor point is in November 2012 near 12,490. This chart pattern needs a third anchor point to confirm the placement of the lower trend line and to fully confirm the channel trading pattern.
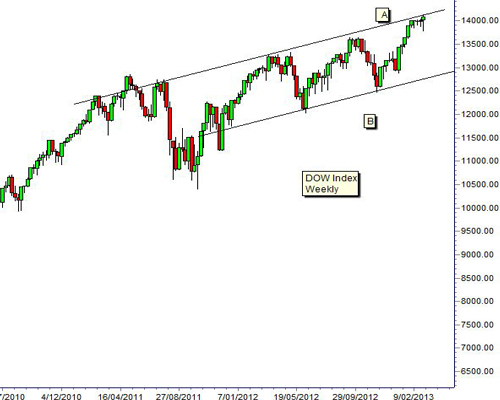
The lower trend line is parallel to the upper trend line. It is projected into the future and this provides a method to determine the potential low for the Dow in any market retreat. The current value is near 12,820. The history of the current trading channel in the Dow shows the market usually takes around seven weeks to fall from the top of the channel to the lower edge of the trading channel. The market rebound and rise towards the upper edge of the channel takes between 10 and 18 weeks.
The 14,198 level is significant because this was the high achieved in October 2007. This becomes an important psychological point for the market. Any move above this level has a high probability of developing a consolidation and a retreat pattern. The 14,198 level is near to the current value of the upper edge of the trading channel. This second feature also increases the probability of a retreat rather than a breakout above the trend line.
The pattern of the trading channel suggests a higher probability to a retreat towards the lower trend line. This retreat may take around seven weeks before a new rally develops. Investors will be ready to protect profits and then prepare to enter the market as the index rebounds from the lower trend line.
Daryl Guppy is a trader and author of Trend Trading, The 36 Strategies of the Chinese for Financial Traders –www.guppytraders.com. He is a regular guest on CNBCAsia Squawk Box. He is a speaker at trading conferences in China, Asia, Australia and Europe.
If you would like Daryl to chart a specific stock, commodity or currency, please write to us at ChartingAsia@cnbc.com. We welcome all questions, comments and requests.
NBC assumes no responsibility for any losses, damages or liability whatsoever suffered or incurred by any person, resulting from or attributable to the use of the information published on this site. User is using this information at his/her sole risk.
The history of the current trading channel in the Dow shows the market usually takes around seven weeks to fall from the top of the channel to the lower edge of the trading channel.
No comments:
Post a Comment