SO MANY SINGAPOREANS ARE MILLIONAIRES=STOCKMARKET SAVVY????
Number of millionaires see a decline in wealth
@CNNMoneyJune 4, 2012: 11:43 AM ET
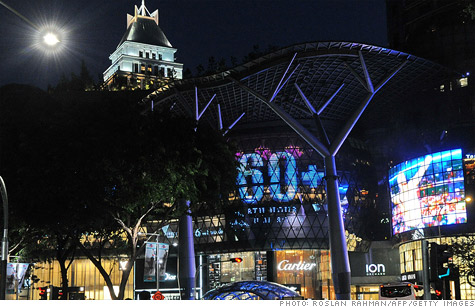
 When it comes to wealth, Singapore has the highest number of millionaires per capita.
NEW YORK (CNNMoney) -- The number of millionaires is on the decline in the United States, even as the number of wealthy individuals has increased worldwide.
Millionaire households in the United States decreased by 129,000 in 2011, according to a new study from the Boston Consulting Group. Globally, that figure grew by 175,000. The report defines these households as having over $1 million in cash, stock and other assets, excluding property, businesses and luxury goods.
Singapore has the highest proportion of millionaires in the world; 17% of all households in the Asian city-state have wealth of over $1 million. By comparison, 4.3% of households in the United States had wealth of over $1 million, which ranks it 7th in the world.
The United States also lagged when it came to the proportion of "ultra-high-net-worth" households, defined by the Boston Consulting Group as those with more than $100 million in wealth.
Switzerland topped the list with 11 in every 100,000 households qualifying as "ultra-high-net-worth," followed by Singapore with 10 in every 100,000 households.
The United States didn't make the top 15, the report said.
Across Asia-Pacific nations, excluding Japan, wealth increased by 10.7% to $23.7 trillion, while it declined by 0.9% to $38 trillion in North America.
The consulting group attributes the shift to strong economic growth in Asia, while the United States grappled with a "near default on U.S. government debt, combined with the euro debt crisis" and "a downgrade of the nation's credit rating."
The group expects to see more of the mega-rich crop up across Asia in the near future.
"Wealth in the region is expected to continue to grow at a double-digit rate... reaching $40.1 trillion by the end of 2016, at which time it will have slightly overtaken Western and Eastern Europe combined." 
YET WE SEE THIS----
Singapore blue-chip stocks made available for $100 monthly
 When it comes to wealth, Singapore has the highest number of millionaires per capita.
Millionaire households in the United States decreased by 129,000 in 2011, according to a new study from the Boston Consulting Group. Globally, that figure grew by 175,000. The report defines these households as having over $1 million in cash, stock and other assets, excluding property, businesses and luxury goods.
The United States also lagged when it came to the proportion of "ultra-high-net-worth" households, defined by the Boston Consulting Group as those with more than $100 million in wealth.
Switzerland topped the list with 11 in every 100,000 households qualifying as "ultra-high-net-worth," followed by Singapore with 10 in every 100,000 households.
The United States didn't make the top 15, the report said.
Across Asia-Pacific nations, excluding Japan, wealth increased by 10.7% to $23.7 trillion, while it declined by 0.9% to $38 trillion in North America.
The group expects to see more of the mega-rich crop up across Asia in the near future.
"Wealth in the region is expected to continue to grow at a double-digit rate... reaching $40.1 trillion by the end of 2016, at which time it will have slightly overtaken Western and Eastern Europe combined."
 By Peace Chiu | Yahoo! Finance Singapore – Wed, Jun 26, 2013 1:56 PM SGT
The bank said the OCBC Blue Chip Investment Plan is targeted at young working adults who may find investing in equities out of reach given the amount of upfront cash needed, as well as busy professionals who have little time to monitor the performance of stocks.
As the purchase of one lot (1,000 shares) can cost up to a five-figure sum, the new plan gives investors an option to buy smaller number of shares with their chosen monthly investment amount, bank officials said during the press launch of the financial product.
Investors can use cash or funds from Central Provident Fund (CPF) or Supplementary Retirement Scheme (SRS) accounts to invest in one or more stocks from a selection of 19 mainboard Straits Times Index (STI) stocks such as CapitaLand Limited, ComfortDelGro Corporate Limited and StarHub Ltd, and the STI Exchange Traded Fund (ETF).
OCBC said it chose blue-chip stocks for the plan as they are nationally-known companies, with a long record of profit growth and dividend payment.
First-time investors also need not go through the hassle of opening securities trading and Central Depository (CDP) accounts as OCBC will buy the stocks on their behalf on a pre-determined date every month.
OCBC Bank head of consumer financial services (Singapore) and group premier banking, Dennis Tan, said the plan makes it “very simple and accessible for anyone who wishes to participate in blue chip stocks, in an affordable way.”
Chew Sutat, executive vice president at SGX, said that, contrary to popular belief, investing in equities is not all about trading and speculating, but also about saving and investing.
He added that the benchmark index for the Singapore stock market STI’s returns are attractive compared to that of other countries.
Chew also noted, “Retail investor participation in Singapore remains low at about 8 per cent compared to 24 per cent in Hong Kong and 17 per cent in Australia.”
SGX hopes to “increase the retail participation rate in Singapore in the next three years to 15 per cent," he added.
To educate the public on the importance of regular investing, OCBC Bank will also work jointly with SGX to organise public seminars and road shows to help raise awareness, starting in July 2013.
NOW YOU KNOW MAJORITY SINGAPOREANS' MILLIONS DO NOT COME FROM THE STOCKMARKET..I REALLY DO NOT KNOW WHERE TO HIDE MY FACE AS A SINGAPOREAN,AS I AM A SHARESLOVER.IN A COUNTRY WITH "CONTRA TRADING"--CAN ACTUALLY HOLD STOCKS WITHOUT CAPITAL FOR 5 WORKING DAYS BEFORE SELLING AWAY ON THE T+5th DAY,CAN ACTUALLY GET TROUNCED BY HONGKONG'S RETAIL PARTICIPATION BEING 24% COMPARED TO SINGAPORE'S 8%.BOTH ARE FINANCIAL HUBS.BOTH ARE CITY LIFESTYLES.BUT WHAT A FUCKING WIDE DIFFERENCE.I LOVE HONGKONG!


No comments:
Post a Comment