SUMMARY OF ALL SP500 UPTRENDS AND CONSOLIDATIONS


THANKS TO YOU ALL-MY PAGEVIEWS SKYROCKETED IN JAN2012,ONE MONTH ALONE is EQUAL TO 6MONTHS OF

PAGEVIEWS!!A BIG THANK YOU

SINCE THIS THREAD "SUMMARY OF ALL SP500 UPTRENDS AND CONSOLIDATIONS" THREAD IS SO POPULAR,THE HIGHEST VIEWERSHIP,I PUT IT IN THE FRONT PAGE

SUMMARY OF ALL SP500 uptrends and consolidations

UPTRENDS-

1. Mostly 10weeks,although some may be 9,11,12.how to recognize?--uptrend "mysteriously" maintained by a diagonal uptrendline connecting the lows of that 10weeks uptrend

2. 1st and last(10th) week always end in surges of aorund 3-6%with the least 1st week gain was 2.7%.The humpy uptrend will "mysteriously" start and end with surges up.

3. If the (X-1)th 10+weeks end below a fibo of the 1576-666 range,THEN the next,Xth, 10+weeks will end AT THAT FIBO.

4. If the (X-1)th 10+weeks end ABOVE a fibo of the 1576-666 range,then the NEXT,Xth, 10+weeks will end AT THE NEXT HIGHER FIBO.

5. Every year's end, at the last trading day of the year,sp500 will end near a fibo of 1576-666 range.

6. Every 10+weeks uptrend will start AFTER a double testing of the diagonal uptrend line formed by the humps from july 13th week 2009.

7. The uptrend in the secular bear market,before breakout 1576, will be a "humpy" ride,whereby i forecast a total of 4 humps to test 1576.

8. After the sp500 breaks out of the 1576 resistance,the diagonal uptrendline will be much sharper than the uptrendline of the 4 humps.

9. The peaks of each hump will occur at AROUND 350-360 POINTS ABOVE THE CORRECTION TESTED FIBONACCI.

10. 2009 REPLICATE 2003,2010 REPLICATE 2004,2011 REPLICATE 2005,SO ON--I mean the closing values and their respective fibo,

CONSOLIDATIONS-CORRECTIONS AND RETRACEMENTS

1. Every correction will have one week of huge plunge about 100points in sp500

2. every Long/HUGE weekly plunge of around 5-8% in the sp500 will be met with a return to the start BEFORE the huge plunge(weekly open) of THAT LONG WEEKLY DOWN CANDLEBODY in 23 to 24 weeks

3. After the peak of each hump has been achieved,there will come a plunge BACK to the fibo of 1576-666 range.---------

eg. 1st hump ended at 1219,near 61.8%,then sp500 plunged back to retest the 38.2%,before the NEXT hump will be formed

eg. 2nd hump peaked at 1370,near the 78.6%,then sp500 plunged back to retest the 50%..so on..

1st correction went to the 38.2%,1013, lowest 1010 and built a base around 1065

-took 24 weeks to reach the open of the HUGE weekly plunge of 120points,week of MAY 3RD 2010

-dropped a total of 210points-2nd week from the top of the 4th 10+weeks uptrend pattern 1217,was the huge weekly plunge

-took 8weeks to hit the lowest point 1010

2nd correction went to 1074 lowest,BUT built a base around the 50% fibo,1120.

-took 23 weeks to reach the open pf the 2nd HUGE weekly plunge of 120points,week of August 1, 2011

-dropped a total of 270points from 1344 and 300points from the HEAD peak 1370

-the huge weekly drop also happened in the 2nd week from the 5th 10+weeks uptrend pattern close peak of 1344.,the LEFT SHOULDER OF THE head and shoulders

-took 9weeks to hit the lowest point 1074

THIS IS THE NEW AND IMPROVISED VERSION OF THE MOST POPULAR POST IN MY BLOG


LET US RECALL THE LIES OF MEDIA OR PEOPLE WHO DON'T KNOW HOW TO EXPLAIN

1)DATA GOOD,COMPANIES EARNINGS GOOD,INDEX DROP= "FACTORED IN" OR "LESSEN STIMULUS HOPES"

2)DATA BAD,COMPANIES EARNINGS BAD,INDEX RISE="INCREASED STIMULUS HOPES"

3)WHEN USA CRISIS CAME,FULL OF CDO SHIT PROBLEM,NO1 KNOWS THERE WILL BE A EUROPE CRISIS IN 2009.THEN CAME EUROPE CRISIS.

4)WHEN EUROPE CRISIS BECOME STALE NEWS,FOCUS SHIFT TO LIBYA GADDAFI TO "EXPLAIN" DROP IN USA MARKETS

5)THEN AFTER GADDAFI NEWS BECAME STALE,THEY SHIFT BACK TO EUROPE AND CHANGE TO "AUSTERITY" SHIT

6)THEN AFTER EURO AUSTERITY NEWS BECOME STALE,THEY SHIFT FOCUS BACK TO USA AND INTRODUCED "FISCAL CLIFF" SHIT JUST BECAUSE BERNANKE MENTIONED FISCAL CLIFF

I "LOVE" THEIR SHIT.EVERYTIME THE STORY BECOMES OLD AND STALE,SOMETHING NEW WILL POP OUT AND THE OLD ONE WILL NEVER BE MENTIONED AGAIN-SINK INTO OBLIVION!!

1ST CDO,LIBYA,AUSTERITY,NOW FISCAL CLIFF.NEXT FUCK YOU!!DID CDO SHIT RESURFACE AGAIN NOW?WHO REMEMBER GADDAFI,LIBYA PROBLEMS SUDDENLY SOLVED FOREVER??

GRANDMOTHER STORY SPINNERS FUCKERS.


19th October 2013
NEPTUNE ORIENT LINES ROBOTIC PATTERN
1) BASE
A-
WEEK oF 17 NOVEMBER 2008—0.93
Week of 9 March 2009—0.85
DOUBLE BOTTOM HIT
3+ MONTHS APART
BETWEEN 1ST AND 2ND BOTTOM
RALLIED +182% IN
1YEAR,1 MONTH, HIT NEAR 2.40 IN APRIL 2010
2) BASE
B-
Week of 22 August 2011—0.98
Week of 21 November 2011---0.995
DOUBLE BOTTOM HIT
3 MONTHS APART BETWEEN
1ST AND 2ND BOTTOM
RALLIED +53% IN 3
months.HIT 1.515 IN 20 FEBRUARY 2012 WEEK


3) BASE
C-
Week of 23 July 2012—1.05
Week of 19 November 2012---1.05
DOUBLE BOTTOM HIT
3+ MONTHS APART
BETWEEN 1ST AND 2ND BOTTOM
RALLIED +30% IN 1.5months.HIT
1.36 IN 7 January 2013 WEEK

4) NOW,IT
IS BASE D TIME
Week of 10 June 2013—1.025
Week of 26 August 2013---1.025
DOUBLE BOTTOM HIT
Near 3 MONTHS APART
BETWEEN 1ST AND 2ND BOTTOM
RALLIED ????% by
??????


N.O.L-NEPTUNE ORIENT LINES-N03.SI (WEEKLY CHARTS) YEAR 2006:6 NOVEMBER TO 1ST JAN2007: 1.77 TO 2.20 (+43c) YEAR 2008:17NOVEMBER TO 5JAN2009: 0.84 TO 1.175 (+33.5c) YEAR 2009:2NOVEMBER TO 11JAN2010: 1.51 TO 1.94 (+43c) YEAR 2010:22NOVEMBER TO 3JAN2011: 2.07 TO 2.40 (+33c) YEAR 2011:21NOVEMBER TO 30JAN2012: 0.995 TO 1.43 (+43.5c) YEAR 2012:19NOVEMBER TO 7JAN2013: 1.055 TO 1.36 (+30.5c)



Wednesday, October 17, 2012

17th october-LINKING BDI AND CHINA TOGETHER TELLS ME AND YOU ALL A VERY REVEALING STORY!!


this is the bdi chart from 1985-2011,i download from other websites.AS YOU CAN SEE BDI HAS A CLOSE CORRELATION WITH CHINA.
THE BDI SURGE FROM 2005 ONWARDS WAS 6X,600% FROM 2000 TO NEAR 12000,THAT WAS EQUAL TO SHANGHAI SURGE FROM 1000POINTS IN 2005 JUNE TO 6200 IN 2007,ALSO 600%.SHANGHAI NOW IS AT 2000,NOT 1000,HENCE BDI AT 981 IS RIDICULOUSLY UNDERVALUED!!!!the true bdi value when shanghai at 2000 points now should be around 4000points.

in summary:

1.SOMETIMES,BDI IS A FORWARD INDICATOR,RALLIED 1ST IN 2001 T0 2005,and AHEAD OF SHANGHAI COMPOSITE,FROM 1000 TO 5000,DESPITE SHANGHAI COMPOSITE DROPPING,THEN BACK DOWN TO 2000 TO SET THE "LAUNCHING BASE" TO TALLY WITH SHANGHAI COMPOSITE 1000 TO 6000POINT SURGE.
STAGES
1)Shanghai composite 1994-2001 surge from 325 to 2245 VS BDI START DROP IN 1995 TO 2001,2500 TO ARD 1000.

2)SHANGHAI COMPOSITE THEN STARTED TO DROP FROM 2001 TO 2005,REFLECTING BDI DROP FROM 1995 TO 2001,2200 POINTS TO 1000POINTS ROUGHLY SIMILAR TO BDI DROP FROM 2500POINTS TO 1000POINTS.
BUT BDI DURING THIS PERIOD SURGED FROM 1000 TO 5000,THEN BACK DOWN TO 2000.

3)SOMETIMES IT IS IN TANDEM WITH SHANGHAI 1000-6000+,BDI 2000-NEAR 12000 FROM 2005 TO 2007.

in conclusion,BDI IS DEFINITELY A CHINA PLAY BUT SOMETIMES IT RUNS AHEAD OF CHINA,SOMETIMES IT IS IN TANDEM WITH CHINA.

17th october 2012-OH MY GOD!! BDI SURGE LIKE FUCK AGAIN!! YESTERDAY +4.2%.ONE MONTH AND 5 DAYS +50%!!!!WHAT THE FUCK?!!!

Baltic Dry Index


BDIY:IND

981.00 +40.00 +4.25%

As of 08:11:58 ET on 10/16/2012.
 
661 TO 981 AND COUNTING IN ONE MONTH AND 5 DAYS

17th october 2012-MY 11TH OCTOBER POST WAS SO SO TRUE!!BUT MUST WAIT TILL FRIDAY TO CONFIRM

MY 11TH OCTOBER 2012 POST-


3)"usa to have shallow retracement to 1422-1437 range in 2-4 weeks"
IN THE END,usa hit 1437 in the 2nd week,this week is the 4th week,revisit 1437,IF THIS WEEK DOES NOT REBOND UP STRONGLY TO CLOSE NEAR 1474 ON FRIDAY,THEN NEXT WEEK,5TH WEEK OF RETRACEMENT,SP500 WILL HIT 1422 AND REBOUND UP STRONGLY"

did you see although SP500 DID NOT HIT 1422 THIS MONDAY,IT DID HIT 1427,VERY NEAR 1422 AND REBOUNDED STRONGLY????????

HOW TO CONFIRM THIS WEEK IS THE 1ST WEEK OF THE 9TH 10+WEEKS OF USA UPTREND??
MUST WAIT TILL THIS FRIDAY NIGHT IN SP500-SP500 MUST,I MEAN MUST END THIS WEEK WITH A WEEKLY GAIN OF >+2% WEEKLY GAINS,END NEAR 1474-THIS IS THE SIGNAL OF THE 1ST WEEK OF THE 9TH.

THIS IS THE SP500 ALGORITHM.I MAJOR IN MATHEMATICS AND ECONOMICS SO I LOVE TO SPOT REPEATED ALGORITHMS.

THANK YOU
YOURS SINCERELY
SHARESWIZARD
 

17th oct 2012-SO OBVIOUS BDI HAS HIT FINAL BOTTOM.compare between many drybulk stocks,YOU WILL SEE MANY HIT DOUBLE BOTTOM WITH 2009 WHEN SOME LOUSIER ONES WENT EVEN LOWER THAN 2009-THIS IS SHARESWIZARD MOST IMPORTANT DIVERGENCE SIGNAL OF FINAL BOTTOM/TOP!!


Disclosure: I have no positions in any stocks mentioned, and no plans to initiate any positions within the next 72 hours. (More...)
The Baltic Drybulk Index has surged 40% in the last 30 days. The index (663 points) was near its 52- week high of 647 points, when a rise in demand for Capes led to a rise in the BDI. The recent increase in marine transportation of coal is also sending bullish signals to the market. What needs to be decided is if the rise in rates is an indication of a complete revival in demand or just a temporary rise because of the approval of infrastructure projects in China, the largest consumer of iron ore in the world.
BDI components:
As mentioned in our earlier articles, BDI is formed of weighted averages of charter rates of Capesizes; Handymax, Supramax and Panamaxes. Each vessel size has its own index (BCI, BHSI, BSI and BPI). These averages then make up the BDI. The following shows the daily trip charter rates for different vessels:

Following shows the change in the indices on 15th October.
Indices Index value Change
Handysize 6536 +1
Capesize 11074 +703
Panamax 6937 +221
Supramax 8110 -82
The iron ore spot prices have increased by 30% since early September. The stock piles are down and the firms are importing more in order to replenish the stocks. According to a news agency in Xinhua, steel prices in China are likely to rebound as the State has approved $156 billion worth of infrastructure spending. 29 capesize vessels in the third week of September were used to haul iron ore to China, the largest weekly volume since March.
The index for Panamax has also risen. Panamax are used to transport coal. The demand has strengthened after the coal inventories at the Chinese power stations declined. A Panamax normally carries 60,000 tons of coal. Demand gained after the stock of coal at port of Qinhuangdao reached 5.5 million tons, 1.5 million tons short of the government target of 7 million tons. Again, the same question needs to be answered, how much of the demand is temporary? In an earlier article, we mentioned that China imports excess coal in the third and fourth quarters as freezing temperatures disrupt the activity at ports for the next three months. Having said that, it is also important to remember that China is planning to increase its electricity generation in the country, therefore, the hike in demand may not be temporary after all.
Conclusion:

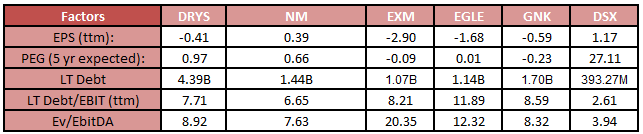
The table above shows the number of Capesize and Panamax that each company has in its fleet. Where DryShips (DRYS) and Diana Shipping (DSX) have the larger number of Panamaxes and Capesizes, Genco Shipping (GNK) and Paragon Shipping (PRGN) also have exposure to coal.
All these stocks are expected to benefit from the rise in coal and steel activity. The bulkers that trade purely on BDI will be the major beneficiary from the surge in BDI. Baltic Trading (BALT) and FreeSeas (FREE) are the bulkers that are a pure play on BDI. Also, most of DRYS' Panamax fleet is on spot charters. However, in the long-run, all bulkers will benefit in case the rise in BDI is sustained.

Tuesday, October 16, 2012

16th october 2012-SINGAPOREANS ARE CASH POOR PART2(EXTRA DISPOSABLE INCOME TO SPEND ON STOCKS AFTER PAYING COE,IPAD)HKEX TURNOVER 7X SGX!!IS HK POPULATION 7X OF SINGAPORE???WORSE IS THAT SGX HAS T+5 TO SETTLE,YET HKIS MUCH LESSER,YET THE MARKET TURNOVER VOLUME IS SO WIDE DIFFERENT!!!


LET US COMPARE HKEX TURNOVER VALUE WITH SGX ON 16TH OCTOBER 2012-OTHER DAYS ARE APPROX SAME AS TODAY NO BIG NEWS FROM HONGKONG SIDE-HKEX IS FLATTISH,SO IS STI.THIS IS THE HALF DAY MARKET TURNOVER VOLUME OF HKEX VERSUS SGX.SGX SETTLEMENT IS T+5,COMPARED TO HKEX T+2,YET HKEX DAILY TURNOVER VOLUME TROUNCED SGX BY 7X?????IF SGX DARE TO REDUCE TO T+2,I THINK THE FULL DAY VOLUME WILL BE LIKE THE HALF DAY VOLUME NOW.

BUT IN TERMS OF TECH SAVVY AND LATEST PRODUCTS,SINGAPORE WIN HONGKONG!!

Market Turnover
16/10/2012


Main Board
HK$25,006.07 Mil
GEM
HK$77.52 Mil
HSI Futures
30,653 Contracts

VERSUS


  Singapore Stock Market
Tuesday Monday
*ST Index 3,053.16 +10.11 3,043.05 +1.3
Volume: 681.8M 1,203.3M
Value:$584.9M $944.6M
Gainers/Losers: 248/101 218/195
 

Monday, October 15, 2012

15th October 2012-haha expected again!ipo in good times,push baby for retards to carry and delist in bad times,aka low prices!!wahahaha!!

PUSH/SELL TO YOU AT 54CENTS


SYNEAR FOOD: Bad indigestion for long-term shareholders!
PDF Print E-mail

synear_products
Synear's products include glutinous sweet dumpling products. Photo: Company
IF A STOCK went IPO at 54 cents -- as Synear Food did - and recently traded at 13 cents, it’s a nasty fall indeed.

In the case of Synear Food, it’s been a nightmare many times over for investors who bought the stock when it was a market darling after its IPO in Aug 2006.

The stock had climbed to, and stabilised, above $1.50 throughout 2007.

After spiking up to nearly $2.50 in Oct 2007, it crashed during the Global Financial Crisis of 2008.

When the market recovered in 2009, somehow the pieces of Synear never quite came together again.

As a result, Synear is among the worst performing S-chips (or non-S-chips) still around today - ie, if we exclude those that have been suspended for accounting issues.

In absolute dollar terms, Synear has lost over S$3 billion in stock value in the last 4-5 years. That's massive value destruction indeed.

It is hard to imagine Synear as being one of China's largest producers of frozen food, including sweet and meat dumplings.

And it was an official supplier to the 2008 Beijing Summer Olympics?

In fact, the Synear brand has been voted as one of "China's Top 500 Most Valuable Brands" for seven consecutive years from 2004 to 2010.(my comments--can news be trusted?????????)

What wonderful accolades -- but where are the glorious profits for investors?

The chart for its stock price says it all – the flattish line resembles the extremely dire condition of a hospitalized patient on a life-support machine.....

BUY BACK FROM YOU AT 18.6C--


Synear Food directors say yes to delisting offer
Mainboard-listed Synear Food Holdings announced on Monday that its directors have approved an offeror's proposal to buy over the quick-freeze food company at S$0.186 per share and delist it on the SGX.


Sunday, October 14, 2012

14th october 2012-wow,just now in my previous post,i said bdi is about 1.5x bdi stocks rate-let us see china cosco hk stockcode 1919 oct2007 peak AGREES TO MY MATHEMATICAL FORMULATION OF BDI AND BDI STOCKS RELATIONSHIP!

1919.hk peaked at around 40+hkd,OCTOBER 2007 now it is only worth 3+ hkd.,mercator listed in singapore only in the week of 10th december 2007 at 76cents,CHINA COSCO 1919 HAD ALREADY PLUNGED and was trading at only 27+ hkd.

from around 27+ hkd to 40+ hkd is a rise of around 50%,which means that IF MERCATOR LINES was listed before the stockmarket peak in oct2007,mercator share price will be 50% higher than the 76c IPO price,GIVING MY EARLIER POST OF BDI AT 11000,MERCATOR WILL BE Around S$1.20,a around 50% increase from 76c

I NEVER EXPECTED MY FORMULATION TO BE SO PRECISE!!HENCE STOCKMARKET SHAREPRICES ARE ALL CONTROLLED BY AN ALGORITHM!

DESPITE DIFFERENT COMPANIES HAVING DIFFERENT FUNDAMENTALS,AT THE END OF THE DAY,SAME INDUSTRY STOCKPRICES BEHAVED THE SAME WAY IRREGARDLESS OF FUNDAMENTALS.CHOOSING GOOD FUNDAMENTALS COMPANY WILL ONLY ENSURE YOU PEACE OF MIND (of bankruptcy,collapse)WHEN INVESTING AND BEING THE FIRST TO BE "FRIED UP" BUT SHARE PRICES BEHAVE ROUGHLY THE SAME(unless there is takeover,etc)!!

JUST LOOK AT CHINA COSCO AND MERCATOR,THE CHARTS LOOK LIKE AN EXACT REPLICA!!

DIFFERENT COMPANIES,DIFFERENT COUNTRIES OF LISTING,DIFFERENT COUNTRIES OF OPERATION,DIFFERENT FUNDAMENTALS,BUT SAME CHARTS!!AMAZING!

LET ME DO THE HONOURS OF UNRAVELLING SIMILAR POINTS IN THE CHARTS OD MERCATOR SINGAPORE AND CHINA COSCO
mercator 18c = china cosco 5hkd
mercator 20c resistance= china cosco 5.5 hkd
mercator 25c resistance=china cosco 8 hkd
mercator 44.5 resistance=china cosco 13hkd

Saturday, October 13, 2012

13th october 2012-stockmarket loves "old friends"

what do i mean by "old friends"?in technical language it means double tops or double bottoms or triple tops or triple bottoms.

mercator lines is a cyclical industry company.

march-june2009,for example bdi around +600% from 663 to 4100,mercator lines +400% from 11c to my 44.5c dumped in june2009.-bdi rise 1.5x mercator stock price rise.

applying this ratio again,660 to 11700 peak in 2008,it is about  1700%,mercator rise if it obeys the 1.5x rule,it will be around 11x from 11c-S$1.20

bdi may or may not revisit the highest point due to fundamental reasons BUT i am sure it will revisit the 4661 set in november 2009 BEFORE THE NEXT CRISES.that will mean mercator lines will return back to the 44.5c AT LEAST before the NEXT CRISES COMES IN 2015-2017.

TIME IS RUNNING OUT.NEXT YEAR WILL BE 2013.STOCKMARKET ALWAYS SURGE TO "OLD FRIENDS" PRICES BEFORE THE NEXT CRISES COMETH.THERE MUST BE OVER JUBILATION BEFORE IMMENSE PAIN COMES AGAIN.

THERE MUST BE A "DECENT" ECONOMIC RECOVERY ENGINEERED OUT BY THE FOMC BEFORE FOMC COULD START INCREASING INTEREST RATES.CYCLICAL STOCKS WILL BE THE 1ST TO PROFIT WHEN THE ECONOMY RECOVERS.

MERCATOR LINE 25C IS AN IMPORTANT SUPPORT THAT BREAKS DOWN AND NOW IT BECOMES AN IMPORTANT RESISTANCE.MERCATOR LINES HAS TO SOMEHOW,SOME"WHEN" REVISIT THIS 25C VERY SOON AS TIME IS RUNNING OUT BEFORE THE NEXT CRISIS.25CENTS IS THE 1ST RESISTANCE,HENCE IT WOULD NOT BE THE END OF THE ROAD OF UPTREND FOR MERCATOR LINES.THE 2ND RESISTANCE OF COURSE WILL BE THE 38C-44.5C RANGE.

mercator lines is one of the better companies in the worst industry.it ain't a super condemned companies like sunmoon,carriernet,magnus energy whose stockprices are like vampire,only being fried up NEAR THE FINAL BULL RUN.mercator lines IS A CYCLICAL STOCK.please understand the difference.MERCATOR IS LIKE A VAMPIRE STOCK NOW BECAUSE OF THE BDI STAGNANCY.

BDI HAS ALREADY STARTED TO SURGE 40% IN ONE MONTH,SEPT 12 2012 TO OCT 12 2012.

---said on 13th october 2012

13th october 2012-BDI IS UP ANOTHER WHOPPING 2.55%-40% RISE IN ONE MONTH!

Baltic Dry Index


BDIY:IND

926.00 +23.00 +2.55%

As of 08:17:05 ET on 10/12/2012
 
WHAT A HUGE JUMP FROM SEPT 12 2012 VALUE 661 TO OCT 12 2012 VALUE 926
 
+40% IN ONE MONTH!!

Thursday, October 11, 2012

11th october 2012-i recollect the predictions i made in my blog

1)in august &sept 2012 i said-"hangseng to outperform sti and sp500 very soon.at 19k hangseng there is a 10% arbitrage chance."

IN THE END-VERY SOON,SURE ENOUGH HANGSENG RECOVERED ALL THE 10%.NOW IT IS AT 21K.

EVEN WHEN SHANGHAI TODAY -0.8%,USA LAST NIGHT -0.6%.HANGSENG IS "STRONG" SIMPLY BECAUSE OF RECOVERING "LOST GROUND"-LOOK AT MY BELOW POST OF "FIBO RELATIONSHIP BETWEEN THE 3 BROTHERS"

Hong Kong Stock Exchange Hang Seng China Enterprises Index


HSCEI:IND

10,231.20 +190.09 +1.89%

2)"usa to have a shallow retracement AFTER HITTING 1460-1480 range."
IN THE END THE MAX OF THE 8TH 10+WEEKS UP WAS 1474.

3)"usa to have shallow retracement to 1422-1437 range in 2-4 weeks"
IN THE END,usa hit 1437 in the 2nd week,this week is the 4th week,revisit 1437,IF THIS WEEK DOES NOT REBOND UP STRONGLY TO CLOSE NEAR 1474 ON FRIDAY,THEN NEXT WEEK,5TH WEEK OF RETRACEMENT,SP500 WILL HIT 1422 AND REBOUND UP STRONGLY

4)i criticise singaporeans' meaningless selling of mercator last friday-10lots at 11.3 when clearly BDI +5.89% on friday morning.RETAIL PLAYERS SO HARD UP FOR S$1,000? THAT THEY MUST ANYHOW THROW AT THE BID SIDE?
IN THE END,JUST 4DAYS LATER,MERCATOR LINES REBOUNDED UP STRONGLY TO 12C,TOTAL DAILY VOLUME 500LOTS!!!!


Result for : [ WatchList ]
Records : [ 3 ]
As at 11-10-2012 5:04 PM


Page [ 1 ]
Counter Name SIP Cde Rmk Last Chg % Vol BVol Buy Sell SVol Open High Low Value Sector
Mercator EE6 0.120 +0.004 +3.448 500 10 0.119 0.120 69 0.116 0.120 0.116 58,322 TSC

Wednesday, October 10, 2012

10TH OCTOBER 2012-REMEMBER MY 19TH SEPT POST AND WEEKS EARLIER SMS TO MY FRIENDS???did not it come true now?

19th sept 2012-WEEKS BEFORE,I smsed my friends about hangseng outperforming sp500 and sti in this leg up-HOW DO I KNOW?

let us recall the mysterious relationship of the 3 brothers' respect to fibonnaccis

hsi was 2 fibos below sp500's( >78.6%)fibo at march 2012
sti(>61.8%)was 1 fibo below sp500's fibo at march 2012.

so hangseng at 19k was a SUPER GREAT ARBITRAGE OPPORTUNITY AS IT DOES NOT MAKE SENSE,AN OVERDUE RALLY IS ON THE WAY TILL IT BRINGS HANGSENG TO > 21300(>50%) by year end.

THIS "STRENGTH" in the hangseng will only bring hangseng to 22K-22.5K.UNLESS CHINA BREAKS OUT OF 3+ YEARS BUMP RUN FORMATION,HANGSENG WILL CONTINUE TO UNDERPERFORM.

I AM WAITING TO SEE CHINA BREAK OUT...if china sse hit 2700,then hangseng will go up to 24K,the 61.8% fibo(same time when usa sp500 hit the fibo 2 levels higher,maintain the same relationship of hangseng being 2 fibos lower than sp500's fibo)

if china sse breaks out of the bumprun to 3.4k,then hsi will surge to 27.5k,the same time when sp500 hit same 100% fibo 1570,CUTTING THE DIFFERENCE TO HANGSENG BEING 1 FIBO LOWER THAN SP500'S FIBO

HSI 22K 1ST RESISTANCE,SAME TIME HIT WHEN SSE HIT 2400

HSI 24K 2ND RESISTANCE,SAME TIME HIT WHEN SSE HIT 2700,BREAKOUT POINT

HSI 27.5K,SAME TIME HIT WHEN SSE HIT 3400

HANGSENG ALL DEPENDS ON CHINA TO "COOPERATE" WITH USA UPTREND
 
--19th sept 2012 posted AND smsed to my friends this same msg in august 2012

10th october 2012-look at my 27th sept 2012 post-HANGSENG IS SUPERMAN TODAY AND YESTERDAY

SEPT 27 2012 POST:

"I TOLD YOU ALL IN MY POSTS EARLIER THAT DURING USA RETRACEMENT PERIOD, AFTER THE 8TH 10+WEEKS UP,HANGSENG AND STI WILL NOT FALL AS IT WILL BE WELL SUPPORTED BY CHINA'S RISE."

yesterday,9th october 2012-hangseng +0.5%,sti -0.3%
today,10th october 2012-hangseng -0.2%,sti -0.8%

let us check at the end of usa 8th 10+weeks uptrend pattern,sti finish 3070,sept 10th 2012 week
hsi finish 20629,now it is 20900
sp500 was 1465

today,october 10th 2012- sti at 3040,-1% down
hsi 20900,UP 1.5%
usa 1440,around -2%

HENCE YOU CAN SEE STI FELL LESSER THAN USA.HANGSENG EVEN WENT UP!!

LET ME TELL YOU A STORY-
AFTER EURO CRISIS PART 2 IN 2011,HANGSENG TUMBLED MORE THAN STI AND USA,CAUSING HANGSENG TO BE 2 FIBOS LOWER THAN SP500'S FIBO AND 1FIBO LOWER THAN STI'S FIBO.

TODAY,BOTH STI AND SP500 ARE ABOVE THEIR 61.8%,2970 AND 78.6%,1380 RESPECTIVELY WHEREAS HANGSENG IS STILL BELOW ITS OWN 50% FIBO,21300.

HENCE AT 10TH OCTOBER 2012,STI AT 3040 AND SP500 AT 1440,BOTH AT 2 TO 5 % HIGHER THAN THEIR RESPECTIVE FIBOS,HENCE HANGSENG SHOULD BE TRADING AT AROUND 21800 TO 22400,2 TO 5% HIGHER THAN 21300.

WHEN STI GO TO ITS 78.6%,3380,SP500 AT ITS 100% 1570,HANGSENG WILL BE AT ITS USUAL 61.8% FIBO,MAINTAINING 2 FIBOS LOWER THAN SP500'S 100%,1 FIBO LOWER THAN STI'S 78.6%.

HENCE HANGSENG HAS A LOT OF LOST GROUND TO MAKE UP FOR---FROM 21000 TO ITS 61.8%,23800-24000.THAT SHOULD TALLY WITH SP500 AT 1570,STI NEAR 3400.

BUT IF SHANGHAI COMPOSITE BREAK OUT OF ITS 3+ YEARS BUMP AND RUN FORMATION AND GO TO 3.4K,THEN HANGSENG HAS ENOUGH "FIREPOWER" AND EXCUSE TO BOOMZ ALL THE WAY TO ITS 78.6% FIBO,27300-27500,CUTTING THE DISTANCE TO 1 FIBO BEHIND SP500 AND SAME FIBO AS STI 78.6%

AU REVOIR

NOTHING TO DO WITH NEWS AND SHIT

i'll be back again


10th october 2012-HAHA SINGAPORE NEEDS A REVISION TO STAY OUT OF TECHNICAL RECESSION.THE 1ST ASIAN ECONOMY TO ENTER RECESSION IN 2008 DOES IT AGAIN!!

Q2 upward revision might spare Singapore from technical recession: OCBC

Services sector most likely to get revised higher and save the day.
Here's more from OCBC:
Much ado over a technical recession, but Q3 still likely to contract qoq. Market expectations for a Q3 technical recession (defined as two consecutive quarters of sequential contraction) has been building following a slew of disappointing economic data, especially from the manufacturing sector. Our existing forecast is for Q3 growth to come in at +1.4% yoy (-0.3% qoq saar). However, a technical recession may be avoidable if the Q2 growth estimates, initially tipped at +2.0% yoy (-0.7% qoq saar), could be revised higher - it only needs to be shaded up by 0.2% points to 2.2% yoy to be flat qoq saar in Q2 2012.
The most likely candidate for the Q2 upward revision could be the services sector which only expanded a tepid 0.8% yoy in Q2, compared to manufacturing’s +4.5% and construction’s 5.3% growth. Assuming that Q2 GDP growth does get revised higher to reflect at least flat qoq saar growth, then our Q3 growth forecast could shade even lower to -1.0% qoq saar, but we retain our +1.4% yoy call.
It is arguable that a technical recession story would help justify a policy easing, and conversely, the absence of a technical recession may bolster the case for policy status quo. Nevertheless, in our view, the more important factors would be if there is any significant changes to the 2013 growth and inflation outlooks – for instance, anticipative of a significant deterioration in the global growth trajectory in H1 2013, especially for China. The twin challenges of the upcoming US’ fiscal cliff and the deepening recession story for the Eurozone economies also remain intact. The official 2013 growth forecast is only due at a later date, but the median growth forecast currently stands at 3.9% yoy for both FocusConsensus and the Sep MAS professional forecasters survey, which is higher than our 3.5% yoy 2013 forecast.
For now, the risk of headline inflation climbing higher looks slightly more remote now that crude oil prices have retreated, and the recent property measures may cool market sentiment at least in the near-term. That said, the threat from QE3-fuelled liquidity coupled with a fairly tight domestic labour market given the foreign manpower constraints, suggest that the core inflation may not subside below 2% handle easily, and that may be the policy focus at this juncture. The SGD NEER is trading +0.9% from parity, so there’s conceivable policy room to stay or ease.

Tuesday, October 9, 2012

9th october 2012-i told you all usa still in retracement UNLESS WE GET THE SIGNAL OF 1ST WEEK UP OF 9TH 10+ WEEKS UPTREND

TODAY HANGSENG +0.5%,STI -0.3% ALREADY "INFORMED" YOU AND I TONIGHT USA WILL FALL.HANGSENG WAS BOOSTED BY CHINA UP,BUT STI DID NOT.

THAT WAS WHY I SAID IN THIS USA RETRACEMENT STARTED 3 WEEKS AGO,HANGSENG WILL BE FLAT OR HAVING UPSIDE BIAS DUE TO CHINA SURGE UP!

HOW RIGHT I AM TILL NOW.

IF SP500 CLOSED THIS FRIDAY AT 1437 OR NEAR 1437,NEXT WEEK SP500 WILL TEST 1422 AND SURGE UP STRONGLY.IF THAT HAPPENS,THEN NEXT WEEK WILL BE THE 1ST OF 9TH 10+ WEEKS UPTREND PATTERN.

BUT IF SP500 TOUCH 1422 TOMORROW,AND REBOUND STRONGLY THIS THURSDAY AND FRIDAY,AND CLOSES NEAR 1474,THEN THIS WEEK WILL BE THE 1ST WEEK OF 9TH 10+WEEKS UPTREND PATTERN.

LET US SEE THE UNRAVELLING OF THE DRAMA

Sunday, October 7, 2012

7th october 2012-singaporeans are cash poor after monthly deducting $70k-$90k coe,property mortgages that such a good stock also no money to support

one person told me mercator singapore is a non index stock,eagle,dryships,navios maritime are all index stocks,BUT THEY FAIL TO REALISE THAT SOME INDEX STOCKS ARE LOUSIER THAN NON INDEX STOCKS.

look at eagle shipping-ALMOST CLOSE SHOP,bankrupt!!

MOREOVER MERCATOR SINGAPORE ALTHOUGH SMALL IN MARKET CAP,BUT ITS PARENT CO. MERCATOR INDIA IS 2ND LARGEST PRIVATE SHIPPING CO. IN INDIA

AND MERCATOR SINGAPORE IS STILL PROFITABLE,AND GIVES OUT DIVIDEND WHEREAS INDEX EAGLE IS ON THE BRINK OF BANKRUPTCY!!I THINK FUNDS AIN'T STUPID TO MISS OUT A GEM AND PICK EAGLE BLINDLY JUST BECAUSE IT IS A INDEX STOCK.

EVEN A CO. ON THE BRINK OF BANKRUPTCY,IN A COUNTRY OF 8% UNEMPLOYEMNT RATE(AFTER FACTORING IN USA POPULATION 60X OF SINGAPORE,300+M VS 5+M),AVERAGE DAILY TRADED VOLUME IS 80+K,VALUE USD $240+K,FRIDAY TURNOVER VALUE IS USD $160K,WHEREAS MERCATOR PROFITABLE,GIVES DIVIDEND.NOT ON BRINK OF BANKRUPTCY,IN A COUNTRY OF UNEMPLOYMENT 2%,friday turnover value is ONLY S$1.3K

AIN'T THIS A SIGN THAT SINGAPOREANS ARE NOT CASH RICH TO APPRECIATE SUCH A GEM IS LISTED IN THEIR OWN COUNTRY!!?

i rest my case

Eagle Shipping (EGLE) Headed for Bankruptcy

March 10, 2012 – Comments (0) | RELATED TICKERS: EGLE

The collapse of dry bulk shipping rates over the last three years has caused the bankruptcy of several shipping companies, including Omega Navigation Enterprises and General Maritime Corporation. With this winter's decline in Supramax spot rates from over $14,000/day to under $8,000/day, it is likely that the shipping industry hasn't seen its last casualty. (See "BSI" on pg. 3, here and here).
Eagle by the numbers
When Eagle Bulk Shipping (EGLE) released its last report in November of 2011, the company's financial position already looked grim. The company had $1,129m in debt, and was facing a steep series of debt repayments scheduled for 2012. Specifically, the company was required to raise the following amounts over its next three fiscal quarters:
$28m in principal repayment, due June 30, 2012.$36m in interest repayment ($12m over three quarters).$9m to raise cash reserves from $27m to $36m (a loan covenant requirement)
Total: $73m by June 30, 2012
Eagle is unlikely to generate this kind of income. To achieve this the company would need to bring in $24.3m per quarter, which is unlikely considering their EBITDA was only $25.9m during Q3 2011, a period when Supramax shipping rates were at nearly double their current level.
To get a better picture of what kind of earnings we can expect from the company, I've built a model to forecast the company's earnings using the charter rates for each ship. I've calculated the daily income for each ship by subtracting $5300 in vessel operating expenses from each ship's daily revenue; for ships that aren't chartered out at fixed rates, I've substituted the average Supramax spot rate from each period. This ought to give us a reasonable estimate of the company's gross profit for each quarter. From this we can estimate earnings by subtracting the other major expenses of a shipping company, which are brokerage fees, drydocking expenses and overhead. I've estimated these expenses using their values from the last quarter. This gives us the following earnings projections:
As you can see, we should expect the company to only make some $37m by the end of March, and with shipping rates at their present levels they are unlikely to generate the remaining $37m they will need by the end of June. Eagle's lenders have restricted the company from selling its ships without permission, so unless they can renegotiate terms with their lenders or find a new equity investor, they won't be able to make their principal payment by the end of June.
Annual report delayed
Eagle has released its Q4 earnings and annual report on March 2 of every year since the company was formed. This year, however, the company has delayed until March 15 to release its report. So why have they delayed? Right now we can only give speculative reasons, but we might conjecture that management was looking for more time to try to renegotiate with lenders or find a new equity investor.
Investors would have good reason to avoid this company, too. Management's reputation has been damaged by a shareholder suit that alleges they stole tens of millions of dollars from lenders and shareholders (see article here, court filings here). On top of this, management registered the company in the Marshall Islands, which allowed them to structure the company in a way that transfers power from shareholders to management. Shipping finance is about trust, and when there are plenty of other shipping companies with trustworthy management that also need financing, we shouldn't expect Eagle to be rescued any time soon.
-Greg Womack
 
 
EAGLE(friday5oct cnbc)
 
DETAILED QUOTE (Delayed)
High Today
3.57
Low Today
3.45
Volume
54.2K
10-Day Avg Volume
83.9K
52-Week High (02/15/12)
9.80
52-Week Low (06/01/12)
2.51
1 Yr % Change (TTM)
-34.28
FUNDAMENTALS
Market Cap
54.7M
Shares Outstanding
15.8M
Price/Earnings
-1.1x
Revenue (TTM)
251.5
Earnings per Share
-3.05
Dividend + Yield
-- (0.00%)
Beta
2.51
 
VS MERCATOR LINES
 
Result for : [ WatchList ] Records : [ 3 ]
As at 05-10-2012 5:13 PM
Page [ 1 ]
Counter Name SIP Cde Rmk Last Chg % Vol BVol Buy Sell SVol Open High Low Value Sector
Mercator EE6 0.115 +0.002 +1.770 12 15 0.115 0.119 14 0.113 0.115 0.113 1,360 TSC

Friday, October 5, 2012

5th october 2012-YESTERDAY BDI UP A WHOPPING 5%

Baltic Dry Index


BDIY:IND

845.00 +47.00 +5.89%

As of 08:10:47 ET on 10/04/2012

5th october 2012--look at my 3rd october 2012 description of 1st week of 9th 10+weeks uptrend pattern

LOOK AT HOW SP500 OBEDIENT IS TO MY DESCRIPTION OF 1ST WEEK'S CHARACTERISTICS.

IF TOMORROW,SATURDAY MORNING(SINGAPORE TIME),SP500 CLOSES NEAR 1474,THEN THIS WEEK WILL BE THE 1ST WEEK OF THE 9TH 10+WEEKS UPTREND PATTERN.

VERY VERY OBEDIENT TO MY DISCOVERED ALGORITHM ON SP500!!!

KEEP TUNED TO THE UNRAVELLING OF THE PRE PLANNED ALGORITHM!!

IF TOMORROW IS SELL DOWN(plunge >1%) or sp500 UNABLE to hit more than 2% weekly gain,1468,THEN SP500 IS STILL IN RETRACEMENT MODE TILL 1422.

I ALREADY CAN SEE THE SCENARIOS EVEN BEFORE THEY HAPPENED!!THAT IS MY 9YEARS EXPERIENCE.

I AM WILLING TO SHARE EVERYTHING WITH YOU ALL BECAUSE I AM NOT A CON MAN, DERIVING INCOME FROM TEACHING PEOPLE HOW TO TRADE.I DERIVE MY INCOME SOLELY FROM RIGHT TRADES.

EXAMPLE,A PERSON PAID THOUSANDS OF DOLLARS TO ATTEND STOCKMARKET COURSES,IN THE END, IT IS ALSO NOT 100% FOOLPROOF.

EVEN,I AM WRONG SOMETIMES BUT YOU ALL HAVE EYES TO SEE WHETHER I HAVE MUCH MORE RIGHTS THAN WRONGS OR MUCH MORE WRONGS THAN RIGHTS.

I CAN ONLY PREDICT USA MAIN INDEX BECAUSE THERE IS AN ALGORITHM.INDIVIDUAL STOCKS,THERE IS HARDLY ANY FIXED ALGORITHM AS SP500 COMPRISES OF 500 COMPANIES,AVERAGED OUT,THERE IS A FIXED PATTERN.

au revoir

i'll be back tomorrow night to SEE WHETHER SP500 CLOSES NEAR 1474


Wednesday, October 3, 2012

3rd october 2012-Last friday usmarkets have confirmed it is retracement time--when will it end?

RETRACEMENT AND NOT CORRECTION TIME

my target is 1422- 1437 as i have smsed my followers and my friends last week.

AS SOON AS WE GET A >2% WEEKLY GAIN IN SP500, PLUS IT CLOSES NEAR 1474 ON ANY PARTICULAR FRIDAY NIGHT,THAT WEEK ENDED THAT FRIDAY NIGHT NEAR 1474, WILL BE THE 1ST WEEK UP OF THE 9TH 10+WEEKS UPTREND PATTERN.

IT COULD BE THIS WEEK, OR NEXT WEEK AS I ENVISAGED A VERY SHALLOW RETRACEMENT

au revoir guys,
I'LL BE BACK

Thursday, September 27, 2012

27TH SEPT2012- I POST MY TECHNICAL ANALYSIS OF 386.HK-SINOPEC

MY PRIVELEGE BANKER FRIEND ASKED ME,SO I UPDATE.

SINOPEC TRADING IN A $2 BAND,BROKE DOWN,TARGET $6.BUT IT WILL FIRST REVISIT THE $8 RESISTANCE BEFORE THE 3RD HUMP IN USA ENDS,WHERE IT WILL GO DOWN AND HIT THE $6 TECHNICAL TARGET.

TECHNICALS WEAK.

27th september 2012--TODAY HANGSENG DEFENDED 20600 AIN'T BY LUCK

HANGSENG EXPECTED SUCCESSFUL DEFENDING OF 20600 SIMPLY MEANS IT IS GOING UP TO MY 22000 OR 25000.

I TOLD YOU ALL IN MY POSTS EARLIER THAT DURING USA RETRACEMENT PERIOD, AFTER THE 8TH 10+WEEKS UP,HANGSENG AND STI WILL NOT FALL AS IT WILL BE WELL SUPPORTED BY CHINA'S RISE.

3 SCENARIOS:

1) IF THIS THURSDAY/FRIDAY,SP500 SURGED UP BY MORE THAN 2% IN EITHER ONE DAY,THEN THIS WEEK WILL BE THE 4TH UPWEEK OF THE 9TH 10+WEEKS UPTREND PATTERN.

2) IF THIS THURSDAY/FRIDAY.SP500 FAILED TO GO UP,NEAR 1460,THEN THIS WEEK=2ND RETRACEMENT WEEK

3) IF ANY WEEK AFTER THIS WEEK SURGED UP BY MORE THAN 2% IN ONE WEEK,THEN THAT WEEK WILL BE THE 1ST WEEK OF THE 9TH 10+WEEKS UPTREND PATTERN.

PICK YOUR CHOICE

HANGSENG AROUND 22000 AT END OF USA 9TH PLUS CHINA SSE DID NOT BREAKOUT OF 2600-2700

HANGSENG AROUND 25000 AT END OF USA 9TH PLUS CHINA SSE BREAKOUT OF 2600-2700

OF COURSE I HOPE FOR HANGSENG 25000 BECAUSE IT IS DAMN HIGH TIME FOR CHINA TO HAVE A SUSTAINED 6-8MONTHS OF SOLID RALLY

AU REVOIR

SEE YOU GUYS SOON

Saturday, September 22, 2012

22nd sept 2012-4 consecutive days BDI +16%!!!

1ST DAY

Baltic Dry Index

BDIY:IND
697.00 34.00 +5.13%

As of 08:13:00 ET on 09/18/2012

2nd day

Baltic Dry Index

BDIY:IND
722.00 25.00 +3.59%

As of 08:14:55 ET on 09/19/2012.

3rd day

Baltic Dry Index


BDIY:IND

755.00 33.00 +4.57%

22nd sept 2012-BOTTOM IN DRYBULK SHIPPING STOCKS?REPORT CUT AND PASTE FROM CNBC

Friday, September 21, 2012

21st sept 2012-this 8th 10+ weeks uptrend has a VERY PECULIAR ALGORITHM

EVERY SURGE FROM JUNE 4TH 2012 WEEK,HAPPENED ON EITHER THURSDAY OR FRIDAY OR THURSDAY AND FRIDAY!!!!

1)june 6th,wednesday- sp500 +30points

2)june 29th ,FRIDAY- sp500 +33points

3)july 13th,FRIDAY- sp500 +22points

4)july 26th,THURSDAY- sp500 +22points

5)july 27th,FRIDAY-sp500 +25points

6)august 3rd,FRIDAY- sp500 +26points

7)sept 6th,THURSDAY- sp500 +29points

8)sept13th,THURSDAY-sp500 +24points

ONLY ONE OUT OF EIGHT SURGES(DEFINED AS MORE THAN 1%) HAPPENED ON WEDNESDAY,7 OUT OF 8 SURGES HAPPENED ON THURSDAY OR FRIDAYS